Unsere deutschen Leser können gerne zur deutschen Versions des Artikels Aktuelle Daten im Search Console Leistungsreport: Können die was? springen.
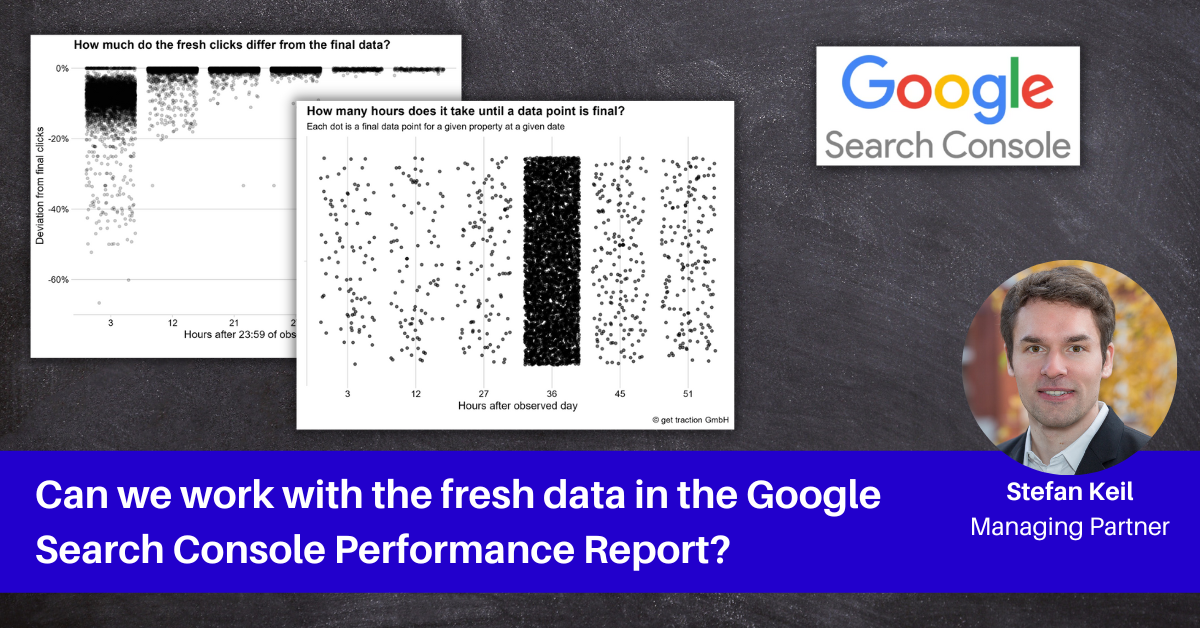
Most people have probably noticed it before: the GSC Performance Report has two different data states. One of them is the fresh data. These are replaced after some time and may differ from the final data. How much do they deviate? And when is the data usually final? Let’s take a closer look at this.
tl;dr
For all the pros out there who know what it’s all about right from the headline, the key takeaways for the german Time Zone (Central European Time):
36 hours after the day observed, most of the data points (93%) in the data we looked at are final.
12 hours after the day observed, the fresh data of the impressions, clicks and position can be used. The deviations are very small.
95% of the data points have at least 97% of the final impressions.
95% of the data points have at least 97% of the clicks.
95% of the data points have a maximum deviation of 0.4% in the position.
You better do not use the performance data for the same day. It can happen that you get more clicks or impressions than you have in the final data. This happens rarely, but can really hurt (differences of + 274%).
Please note that we are evaluating the data from the German time zone, which is why these statements apply to Central European Time (UTC+1). The GSC logs the data in Pacific Time (UTC-7). So Central European Time is 8 hours ahead of Pacific Time.
For our international readers that means that the given values have to be adjusted with the respective time zone.
If your time zone is e.g. 9 hours ahead of Pacific Time, you would have to add one hour to our values – so you could not expect the data quality described here until 13.00 on the following day (not taking into account imprecisions due to our query intervals).
If you are one hour behind Pacific Time (i.e. UTC -8), then you should find the corresponding data quality already at 03:00 on the following day.
So you always have to calculate your difference to our time zone (UTC+1) and add it to the hours accordingly.
Now this does not make it easier to read – sorry for that – we have learned that for the next, international analyses 
Thanks to Valentin for the extremely important hint. Even if I have suffered a small heart attack with it 😅
Detailed introduction: What is fresh data in the GSC?
In September 2019, there was the pleasant news, that we are getting more up-to-date data points in the Google Search Console performance report (https://developers.google.com/search/blog/2019/09/search-performance-fresh-data?hl=en).
The excitement was quickly dampened, due to some limitations.
Google directly clarifies that the data does not necessarily have to match the final data. “Each fresh data point will be replaced with the final data point after a few days. It is expected that from time to time the fresh data might change a bit before being finalized.” It’s a bit daunting at first – after all, you don’t want to have to revise your advices because the data changes.
Availability via API was not given. A limitation that quickly led at least professionals to more or less ignore the feature.
For Discover, there was no fresh data for the moment.
The good news is, 2019 is already a while ago (as of today, about 3 months + some Corona years, which can not be remembered so precisely). Since then a lot has happened and since December 2020 we get the fresh data via API. (https://developers.google.com/search/blog/2020/12/search-console-api-updates?hl=en, Details at https://developers.google.com/webmaster-tools/v1/searchanalytics/query?hl=en) and for Discover, the data are now fresh too.
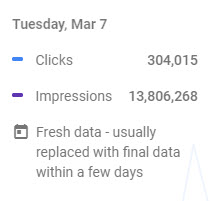
If you don’t really know what I’m talking about, then you might want to take a look at your Search Console. Most of the time, the most recent day in the graph is still marked with a note (just move the mouse over the graph).
Again it is clearly stated via the filter.
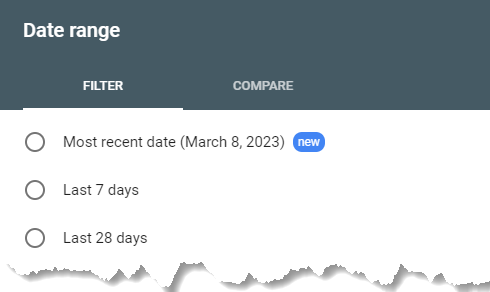
New is always relative – if we really don’t count the Corona years, we can let it pass as new. ![]()
Regarding the possible deviations, the current documentation states (https://support.google.com/webmasters/answer/7576553?hl=en, as of 2023-03-09) the following:
The newest data in the Search Performance report is sometimes preliminary – this means that the data might change slightly before it is confirmed. Preliminary data is usually less than three days old; at some point, all preliminary data is confirmed. Preliminary data is indicated when you hover over it in the chart.
Preliminary data is included in both the chart and the tables for Search performance, as well as the Performance chart in the Search Console Overview page.
This brings us to the actual question.
Google says there may be slight discrepancies. Is the data quality of the fresh data so good, that we can use it in everyday work?
There are of course a few exciting use cases, such as:
Build a rank tracking with the GSC data,
Watch bug fixes and see early on if your performance really gets better, or
For very important campaigns, evaluate the performance on the SERP a little earlier than with a minimum delay of 3 days.
We have asked ourselves this question and are happy to take you on our journey of discovery.
The data set
We have pulled together a small sample of our available properties. Characteristics of the data we considered are the following:
Timeframe: 2023-01-01 to 2023-02-28
89 Properties – including 44 news publisher, 9 online shops and 36 other websites. (services, directories etc.).
The API requests were made at the property level (
aggregationType = byProperty).We only considered searches for the target market – in this case, only German-language websites for DEU, CHE and AUT (Filtered by
country).The searchtype was restricted to
web.We looked at data regardless of device or search appearance.
To give you an even better feeling for the dataset, and also to allow us to apply some segmentation to our observations, we have created the following bins:
by number of ranking pages
by number of ranking search queries
by the sum of clicks
by the sum of impressions
 (To view the media file just click on the image.)
For each of our analyses, we have also used these segments and looked if any further insights result from them. We will return to this in the following, if it is relevant.
How did we collect the fresh data?
We forked our research data from our existing data pipeline. Therefore, we were limited to the following time intervals.
03:00
12:00
21:00
As you can imagine, the data is not collected at exactly the same time for all properties. We have rounded to the above-mentioned times accordingly.
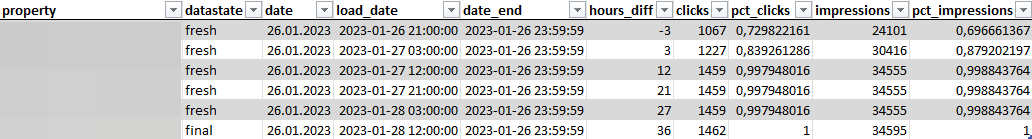
The data looks like this for a property at a given date:
 (To view the media file just click on the image.)
You can see the data for a given property for the 01/26/2023 (date). The first time we queried the data was on the same day at 21:00:00 (load_date). date_end is an auxiliary column that contains the last minute of the day under observation and can be used to calculate the difference in hours of each load interval (hours_diff). The clicks and impressions indicate the respective values that we got back from the API at the given load interval. pct_clicks and pct_impressions indicate the share of the current clicks / impressions of the final values.
So much for the descriptive preliminaries. Let’s move on to the exciting questions!
When are the data usually final?
Here is a quick reminder of Google’s statement:
Preliminary data is usually less than three days old; at some point, all preliminary data is confirmed.
Is this statement true for our sampling period or do we perhaps have data points that take even longer than 3 days?
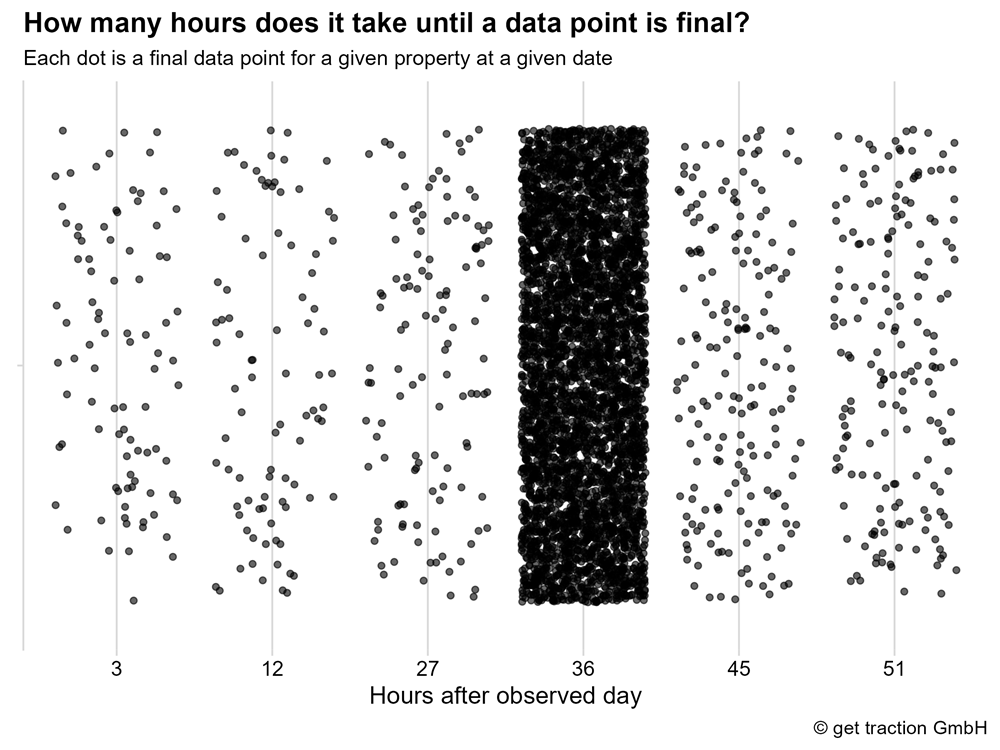
Each data point corresponds to a property and date combination for a final data point.
What we see is that there are even some data points that are final after only 3 hours. But the clear majority accumulates at 36 hours.1 The last final data points came 51 hours after the day looked at – well quite under 3 days. Google has kept its promise in the period examined.
To round it up:
After 36 hours, 93% of the examined data points are final.
Of course, we also looked at the individual bins – you remember the number of queries, the number of pages, the total number of clicks and the total number of impressions. There were no irregularities.
But that is only the first step in the process. Let’s go ahead straight away.
How do the fresh and final data points differ?
Or to put it in very operational terms: Is the fresh data usable at all?
Can we work with the fresh data after 3 hours or should we always wait for the final data after 36 hours?
Deviation of the impressions of the fresh GSC data
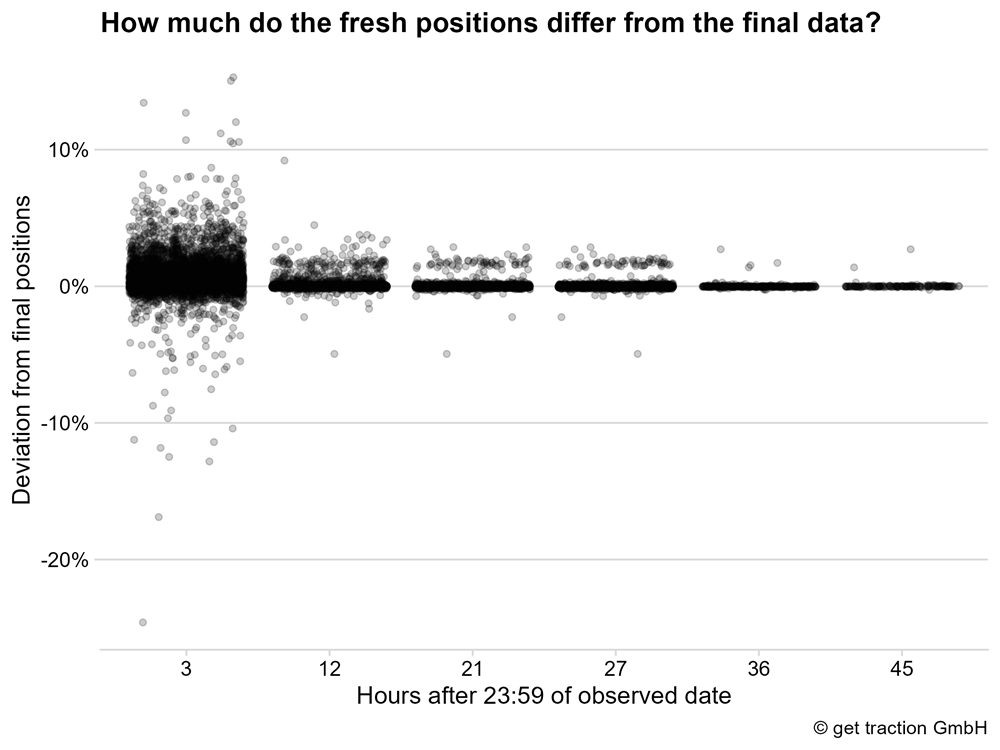
So let’s look at how the impressions of the fresh data compare to the final data.
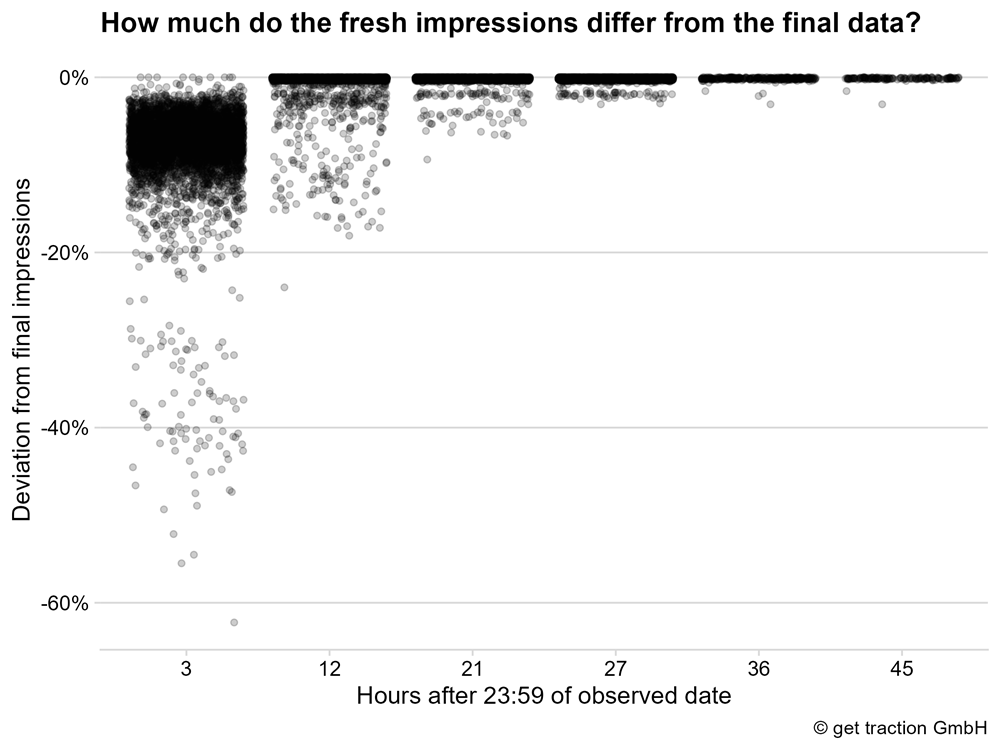
We see that in most cases the fresh impressions deviate less than -20% from the final impressions after 3 hours. In other words, after three hours, the value of most fresh data points already corresponds to at least 80% of the impressions shown as the final value.
Not bad. To be honest, we assumed that the rate would be significantly worse.
After 12 hours, the points are already accumulating at a deviation of almost 0%. Let’s look at the distribution in detail to see it more precisely.
 (To view the media file just click on the image.)
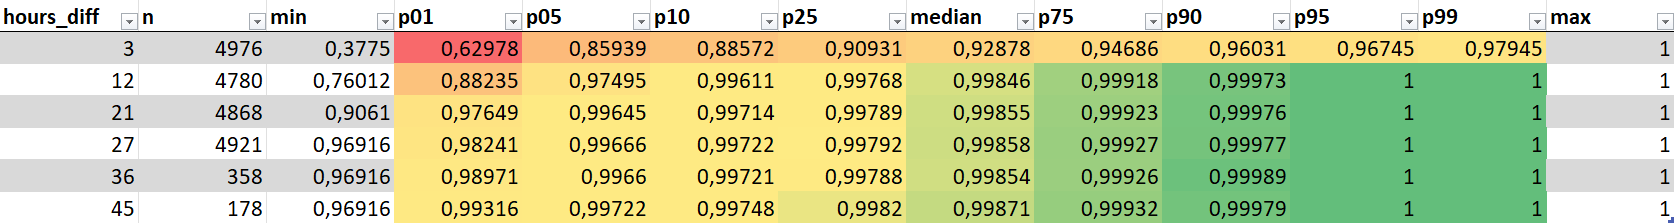
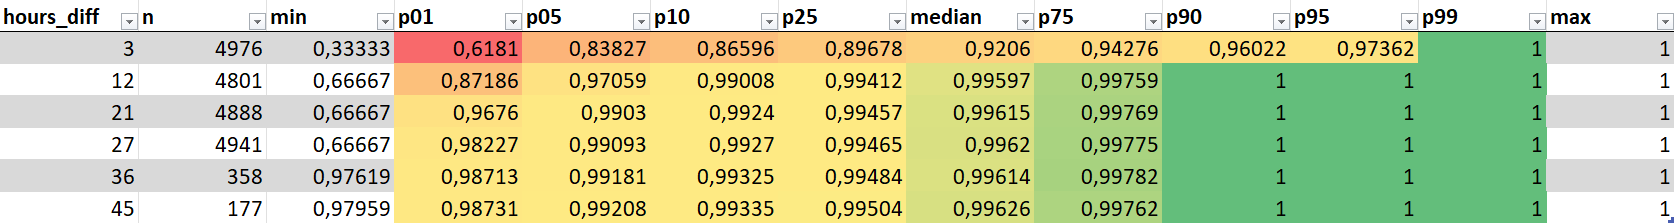
A short reading guide based on the first line – cell by cell:
3 hours after the observed day (
hours_diff),we got 4,976 fresh data points (
n).The data point with the lowest percentage of final impressions (
min), had 37.75% of its final impressions.So if you had a final data point with 10,000 impressions, in the worst case you could get only 3,775 impressions after 3 hours.
The first percentile (
p01), that is the first 1% of observed data points, sorted in ascending order from the lowest proportion to the highest, has a maximum of 62.97% of its final impressions.That means the „best“ data point of the first percentile reaches 62.97% of impressions, all others are below – the minimum value is the already named with 37.75% (min).
In other words, all other 99% of the observed data points show more than 62.97% of their final impressions.
The first 5% of the observed data points (
p05), show a maximum of 85.93% of their final impressions.and so on…
For us, one point has proven to be very solid.
After 12 hours, the first 5% of the data points reach a maximum of 97% of their final impressions. This means that the other 95% of the data points have at least 97% of their final impressions. A stable basis, we would say, stating the following:
12 hours after the observed day, the fresh data of the impressions can be used. The deviations are only very small.
Let’s do the check again with the clicks as well.
Deviation of the clicks in the fresh GSC data
You know the procedure – therefore a bit more briefly.
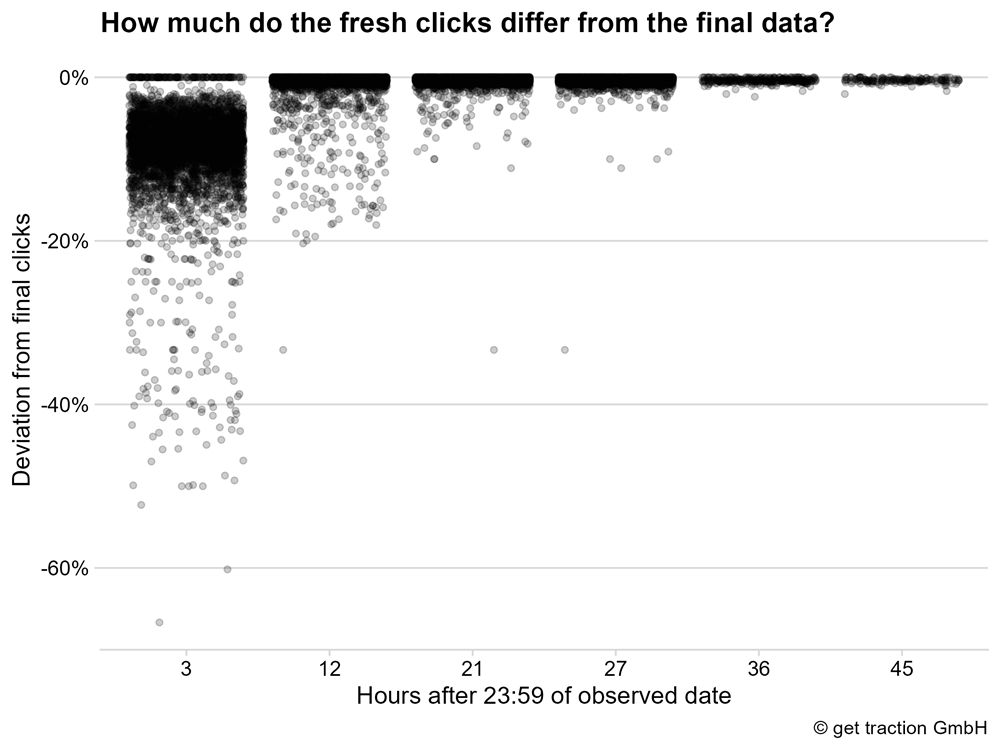
We see the same situation. After 3 hours, the majority of the data points observed show less than -20% deviation from the final data. After 12 hours, it accumulates again at a deviation of almost 0%.
 (To view the media file just click on the image.)
In the table we see: After 12 hours, 95% of the data points have at least 97.05% of clicks.
The deviations from the impressions are not significant. We get the same result.
12 hours after the day observed, the fresh data of the clicks can be used. The deviations are only very small.
Deviation of the position in the current GSC data
Since a little rank tracking can be an exciting use of the data, let’s take a look at the fresh positions in detail.
The graph shows that we still have some deviations, especially after 3 hours. Overall, the trend is more in the direction of a worse ranking – so the deviation is positive. Example: If the ranking after three hours is given as position 11, but the final position of the ranking is 10, then there is a deviation of 10% in the position.
For the distribution table we have made another small transformation of the data. We now only consider the percentage of the deviation of the position, independent from the sign (+ or -). This little trick was necessary because otherwise we cannot put the deviations in a meaningful order to calculate the percentiles.
 (To view the media file just click on the image.)
For example, after 3 hours we have a maximum deviation of 6.2% for the first 1% of the data points. This means that for the other 99% of the data points, we can already determine a deviation of less than 6.2%.
After 12 hours, 95% of the observations have a maximum deviation of 0.4%.
Let’s not talk about it any further. For the metric position, the deviations are generally not very high, and 12 hours after the relevant date, there is no longer any significant deviation.
The position data deviate the lowest. After 12 hours, the deviation is at a maximum of 0.4% – hardly worth mentioning.
Deviations by bins
The attentive reader wonders why we didn’t use the bins formed above. Well, there has never been a clear difference. Means:
Whether your website is large or small, you are not more or less affected by the discrepancies.
But for the sake of completeness, let’s take a look at the deviation of the impressions in the four bins together as an example.
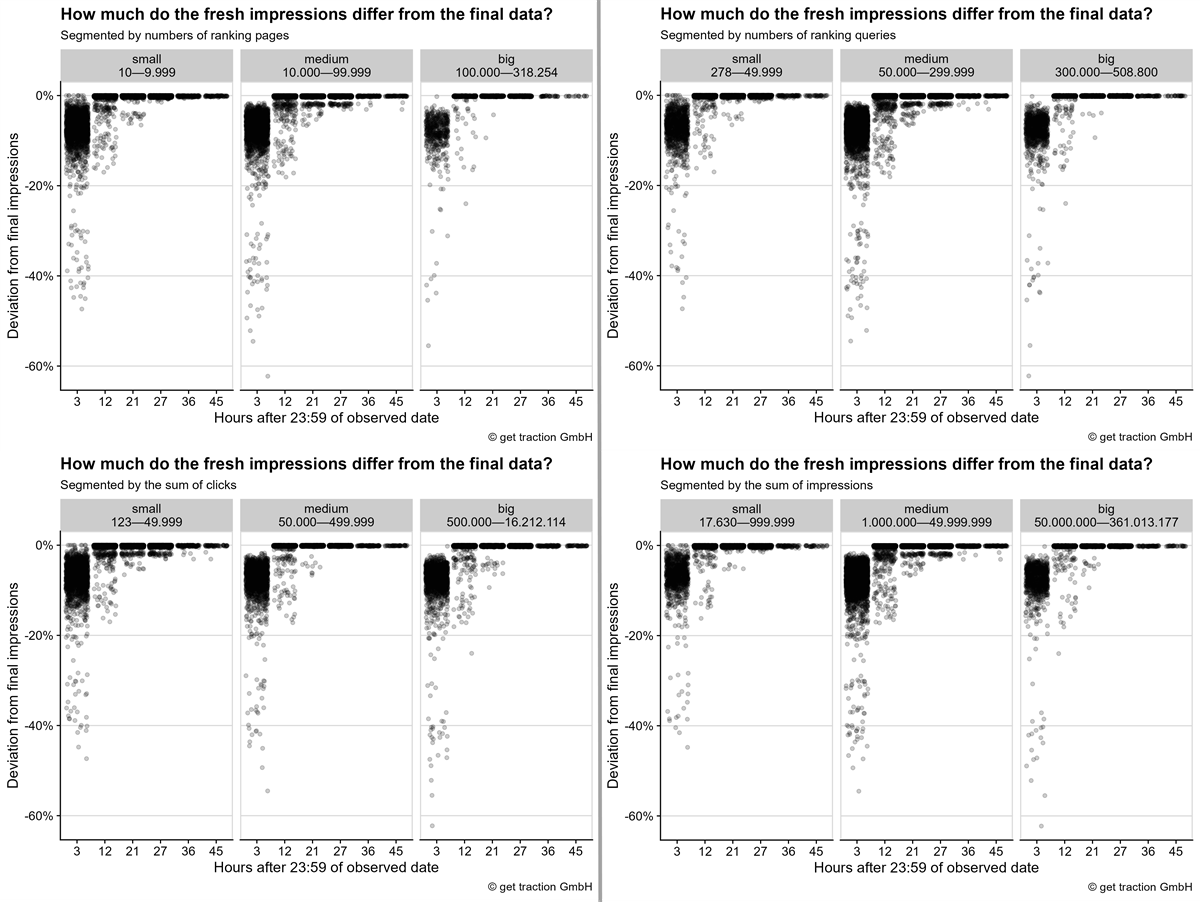 (To view the media file just click on the image.)
Please keep in mind that the number of data points per bin is different. Therefore, there are sometimes more points at the edges because there is a higher total number of data points in the bin. There were no significant discrepancies. In theory you could state that for small websites after 3 hours there are fresh data points that already correspond to 100% of the final impressions more often. However, this is such a small number that it has little relevance in practice.
Fresh data points with more than 100% of final data
As a side note, we would of course like to tell you that we also faked a little bit with the above dataset ![]()
The above analysis should not be made more complex than it already is. Therefore, we have filtered out fresh data points with more than 100% of the final data for simplification.
Like you, we expected the fresh data points to be only part of the final total. Thinking „more data will be added step by step“. This is true, in most of the cases.
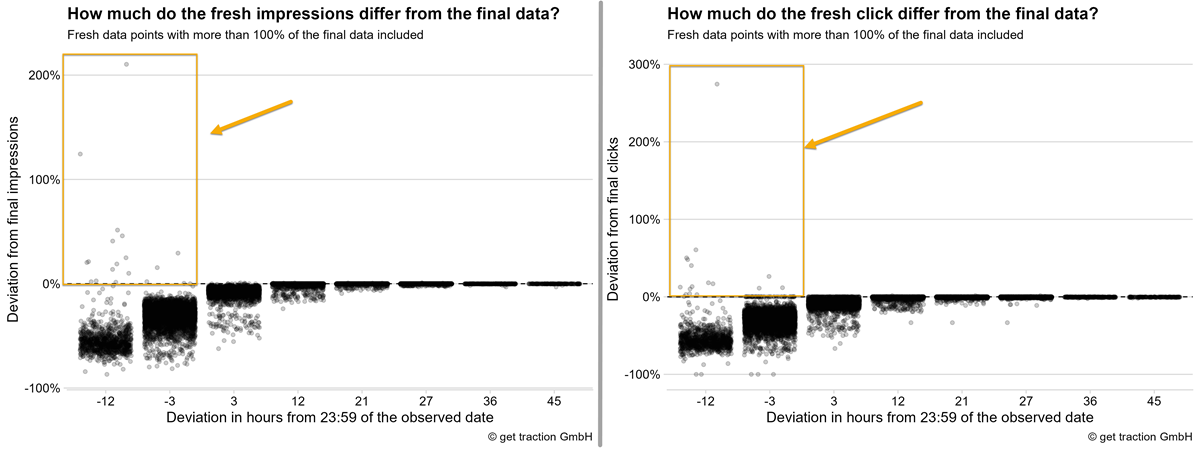 (To view the media file just click on the image.)
As you can see now, there are some data points that are significantly above the final 100% of clicks or impressions. For the clicks there are 33 data points, for the impressions 102 data points.
These always occur when you look at the data for the same day – for example, when you check how many clicks there are for the 2023-03-10, at 12 o’clock on 2023-03-10.
To make it a bit more specific. For example, the largest deviation in clicks was 274% of the final data. In absolute numbers, this was a difference of 19,271 clicks. So you would assume that „so far“ you have 26,293 clicks for the day. But when the data is final, you only have 7,022 left. 🤯
The number of cases is quite small, but something like this is always an unpleasant surprise and a risk if you communicate „too good numbers“ maybe even to your bosses.
So you should wait until the following day before using the fresh GSC performance data.
In principle, we could have explained the deviation in this direction with data protection and the cleaning of particularly rare search queries (see https://support.google.com/webmasters/answer/7576553?hl=en, Paragraph “Data discrepancies”). However, this maximum deviations can hardly be explained by this.
A small critique of methods
While we were processing the data in this way, we naturally came up with a few more ideas.
It would be interesting to observe the metrics number of ranking pages and number of different search queries in more detail. This would answer the following questions:
To what extent does the fresh data show a different number of ranking pages?
Are there actually pages missing or is it just the totals of existing metrics like clicks and impressions that are changing?
To what extent does the current data show a different number of different searches?
Are entire queries missing or do only the available totals of clicks and impressions change?
Are there differences in properties with a more diverse query profile (many different queries, more long-tail vs. few different queries)?
Are there differences when looking at particularly brand-driven sites vs. less brand-driven ones?
These are questions that are asked very easily. However, they are not quite so easy to answer. We would have to completely swap the data set again and push a few million more rows around. We believe that the first insights here are sufficient to know clearly how to handle things in everyday practice. Furthermore, the observation according to the bins formed at the property level has not provided any insights indicating that the named questions might bring a difference. But if you find this exciting and have more questions about it, just make some noise. If you’re loud enough, then maybe we’ll have another go at it!
We’ll skip the conclusion here, since you’ve already read it in the tl;dr above.
Credits
The most important thing at the end: I am the author of the article, I thought it up and typed it down. But a particularly large part of the work has been the collection and preparation of the data. I never could have done this without my colleague Patrick. We slacked and pondered for hours, while he pushed the data around in R directly. His data preparation skills made this article possible in the first place. Otherwise it might have remained an idea. Further thanks also go to Johannes who pushed us on the right track at one point or another and set up our data infrastructure on which everything is based anyway.
Thanks guys!❤️
Special call for our english readers
For our readers of the English version, a special call. This was the first time we’ve done a translation, so we’re wondering: Was this exciting for you too? Do you have any feedback for us? Should we do it again? Let us know via the comments, Twitter or otherwise. We’d love to hear your feedback!
footnotes:
1 Keep in mind, that we only query in certain intervals. So in principle there would be a possibility that the majority of the data is already there after 28 hours, but we get it only after 36 hours.

Stefan Keil
GESCHÄFTSFÜHRENDER GESELLSCHAFTER
Gründer und Geschäftsführender Gesellschafter der get traction GmbH mit einem ❤️ für strukturierte Prozesse, geiles Monitoring und tiefe, analytische Aufgaben.